The Traffic Accident Reconstruction Origin -Article-


The Traffic Accident Reconstruction Origin -Article-
|

|
Review of Statistical Notation and Excel's Keystroke
Statistics This article will serve as a refresher and introduction for the motivated, of statistical
terms and procedures necessary to calculate uncertainty. Mean Recall that statistics carries its own notation. In order to calculate an average (also
called a mean) we add all the values then divide by the count of the number of
values. The statistical notation for this process is expressed as, Here the Sigma (
![]() ) term is read as the Sum of
all tests from
) term is read as the Sum of
all tests from ![]() is read as X bar and is statistical
notation for the mean (or average).
is read as X bar and is statistical
notation for the mean (or average).
Calculating Standard Deviation
Most calculators have the ability to calculate Standard Deviation. Two alternative methods are offered to the reader:
1) A step by step numerical approach
2) A point and click spreadsheet method using Microsoft Excel
A Step by Step Numerical Approach to Standard Deviation
Standard Deviation is expressed as

Examining individual terms:
![]() = Standard Deviation
= Standard Deviation
![]() = The mean or average (see mean above)
= The mean or average (see mean above)
![]() = The result of the
= The result of the
 = the sum of from
![]() = the number of tests
= the number of tests
![]() = a factor to multiply by, it is actually
a division by
= a factor to multiply by, it is actually
a division by ![]()
With these terms defined we will calculate the standard drviation of officer A's drag sled tests as stated in the article. Those values are reproduced here for convenience.
|
Force |
||||||||||
|
Officer A |
22.0 |
23.0 |
24.0 |
24.0 |
25.0 |
25.0 |
26.0 |
26.0 |
27.0 |
28.0 |
The table below contains the difference  ,
and the difference squared
  for each of the
pull results of his sample.
|
Test Number |
Test Results |
Difference between Average and Test |
Difference Squared |
|
1 |
22.0 |
22.0 - 25.0 = -3.0 |
9.0 |
|
2 |
23.0 |
23.0 - 25.0 = -2.0 |
4.0 |
|
3 |
24.0 |
24.0 - 25.0 = -1.0 |
1.0 |
|
4 |
24.0 |
24.0 - 25.0 = -1.0 |
1.0 |
|
5 |
25.0 |
25.0 - 25.0 = 0.0 |
0 |
|
6 |
25.0 |
25.0 - 25.0 = 0.0 |
0 |
|
7 |
26.0 |
26.0 - 25.0 = 1.0 |
1.0 |
|
8 |
26.0 |
26.0 - 25.0 = 1.0 |
1.0 |
|
9 |
27.0 |
27.0 - 25.0 = 2.0 |
4.0 |
|
10 |
28.0 |
28.0 - 25.0 = 3.0 |
9.0 |
|
|
|||
|
Sum = 250.0 |
|||
|
Average = 25.0 |
Sum of Difference Squared = 30.0 |
||
Next divide the sum of the difference squared by
n-1, or 9.![]()
And finally find the square root of the sum of the differences squared divided by
n-1.![]()
So by this example we have introduced the notation and calculated the standard deviation step by step.
Return to Uncertainty ArticleFinding Standard Deviation with Microsoft Excel
Microsoft Excel is a powerful mathematical tool. To find standard deviation with Excel. follow these steps.
Step 1: Open a new workbook and type the test values into column A as illustrated in Figure 1 below.

FIGURE 1
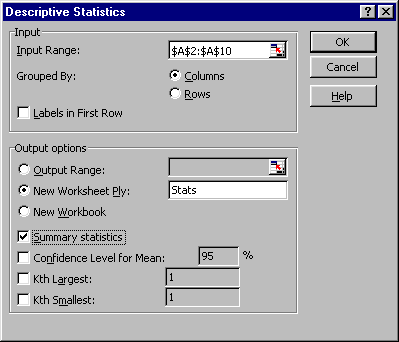
Step 2: Next under the Tools Menu select the Data Analysis option. A window will open offering analysis tools. From this list select Descriptive Statistics . An additional Descriptive Statistics window will open as seen in Figure 2

Figure 2
Step 3: In the Descriptive Statistics window select the gadget in the Input Range box. This will allow you to select cells A2:A11. Before leaving this window check the radio boxes naming a new Worksheet (in this case called Stats or Statistics) and check the radio box Summary Statistics.
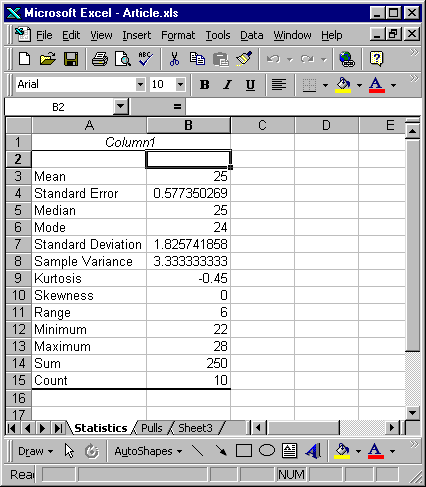
Click OK. Figure 3 results

Figure 3
Step 4: In Figure 3 we see numbers that should appear familiar. The mean is reported as 25. We calculated this average above. The standard deviation is reported as 1.825741. This of course is the same value calculated in the example above. Other values have meaning but they are not necessary for this discussion of uncertainty.
This is just one example how Microsoft Excel can assist the reconstructionist.
Return to Uncertainty Article
|
Copyright ©
|